Time Tracker
React + Express application that centralizes imported time-tracking data, adds manual hours, applies reporting rules, and generates filters, charts, hour reports, and billing calculations for project groups.
Core stack
The challenge
The challenge was turning technical time-tracking entries into a practical tool for reviewing work and preparing reports: aggregation by project and language, filling in missing time, excluding irrelevant projects, filtering by period, and billing calculation for groups with different rates.
The solution
The solution separates the React UI from a simple Express API and uses a normalization/aggregation pipeline in the frontend. The main data and overtime hours are combined, ordered, and enriched with the testing overhead rule, then the same filtered entries feed the statistics, charts, hours report, and billing report. Groups and rates are manageable, the backend reads the EUR rate from the BNR XML feed, and CSV export and print layouts turn the analysis into reusable deliverables.
Notable complexity
Time Tracker is a personal project built as an internal analysis tool over already-collected time-tracking data. The React 19 frontend loads the main entry set and a separate overtime set through the API, combines them chronologically, and calculates statistics by project, language, and day. If the API is unavailable, reads fall back to the static JSON files included in the application.
The reporting pipeline does not use just the raw time. For each project, except for entries marked Unknown Project, the calculation utility adds a fixed 50% overhead for testing/processing and distributes it across the project's entries, keeping the original time and the added time separate. Projects configured as excluded are then removed from statistics and reports. This is an explicit rule of the analyzed snapshot, not a UI-configurable model.
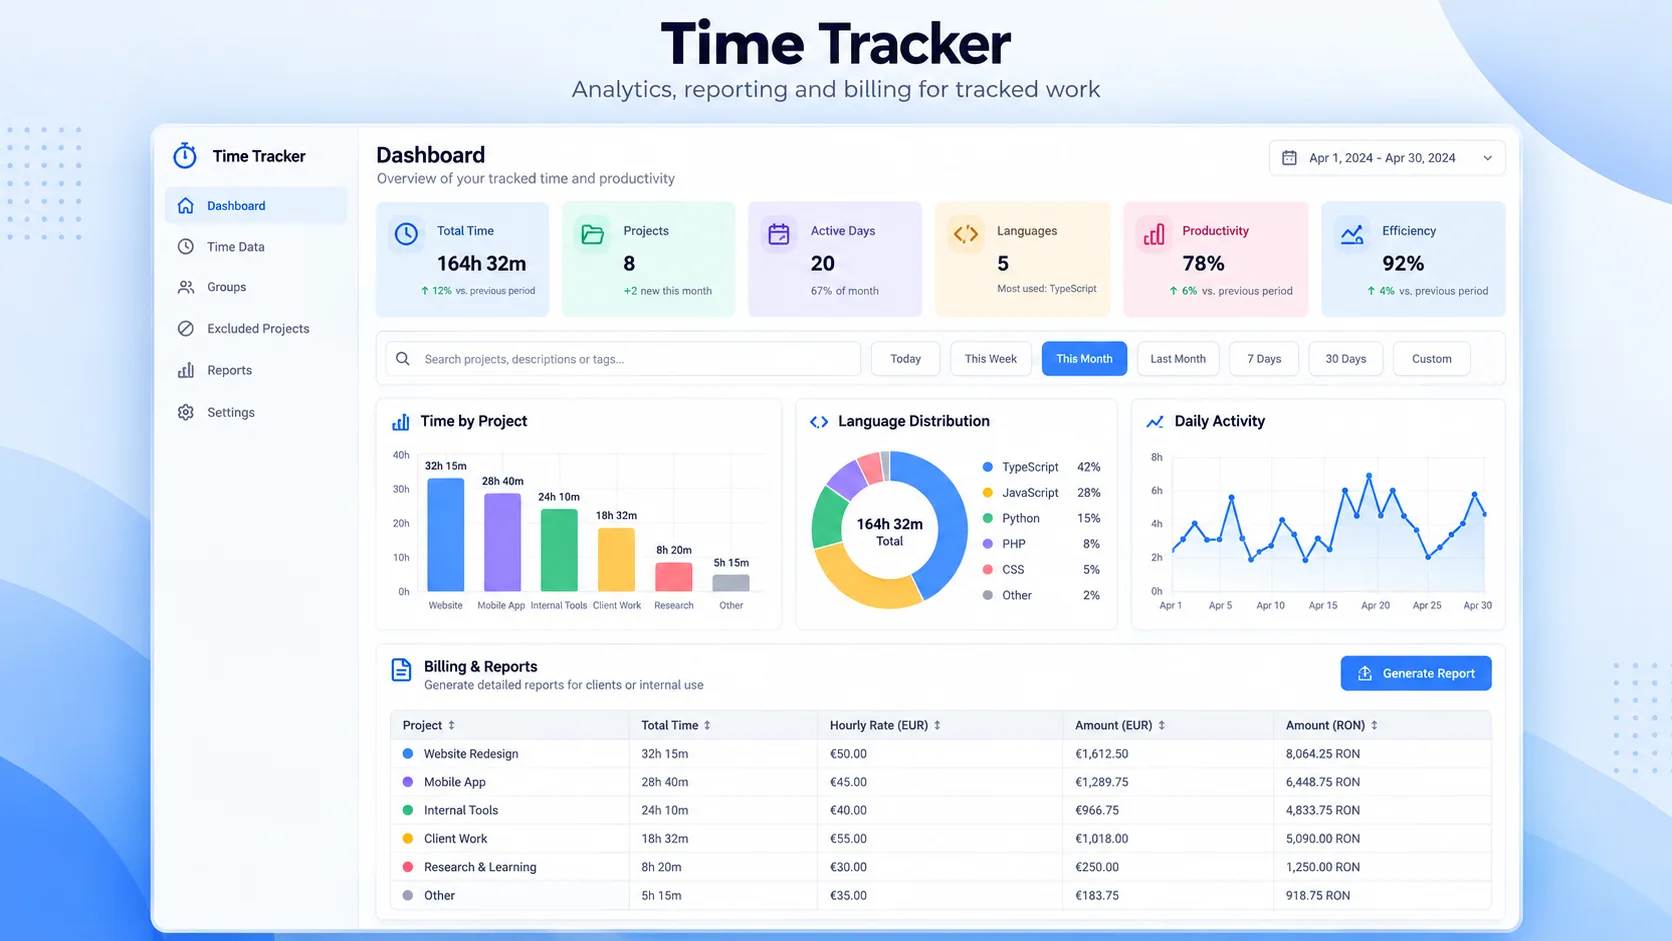
The dashboard offers quick filters for today, this week, this month, last month, the last 7 or 30 days, a custom range, projects, languages, and text search. Filtered data can be exported as CSV. Recharts is used for the top projects, language distribution, and daily activity, and a sortable, paginated table component exists in the code, although it is disabled on the main screen.
For financial reporting, projects can be grouped and associated with an hourly rate. The group report identifies the projects' entries, calculates the resulting hours and value, then requests the EUR exchange rate from the BNR through the backend for an indicative conversion to RON. Both the group billing report and the hours report have dedicated print layouts.
The administrative area includes manual entry addition, CRUD for project groups, bulk JSON import that replaces the main dataset, management of excluded projects, and editing or deleting overtime hours. Some of these operations are accessed via keyboard shortcuts, as an internal interface rather than a separate admin with role-based authorization.
The Express backend persists data directly in JSON files under public/, with no ORM or database. Authentication uses JWT with a 24-hour expiration and an in-memory registry for active tokens. Deployment is prepared for a single PM2 process with automatic restart and file-based logs. The PWA is configured through vite-plugin-pwa with auto-update and caching for static assets/fonts, but the code does not implement Background Sync or an offline write queue.
The snapshot should be treated as a personal tool/operational prototype, not a hardened multi-user product. Extending it toward multi-user use would require additional hardening for credential storage, per-role and per-resource authorization, concurrent/atomic persistence, and automated validation through tests and CI/CD.
Key results
- Authenticated dashboard combining the main time-tracking data with separately persisted overtime hours
- Aggregations by project, language, and day, with totals, averages, and visual distributions via Recharts
- Reporting rule that keeps the original time and separately adds a fixed testing/processing overhead
- Filtering by date range, project, language, and text search, plus quick presets for common periods
- CSV export for the filtered set of entries
- CRUD administration for project groups with an hourly rate and currency
- Group billing report with per-project calculation and EUR/RON conversion using the BNR rate
- Hours report and billing report with dedicated print styles
- Bulk JSON import to replace the main dataset, with a fallback read from static files
- Manual entry addition and separate administration for overtime hours
- Installable PWA configuration and API deployment via PM2
Related projects
- Real Estate ScraperPython tool for collecting and normalizing Storia listings, with parallel scraping, deduplication by listing ID, relational storage, a filterable REST API, and walking, driving, and public-transit distance calculations.
- PDF Auto-PrintPython desktop utility that periodically polls an endpoint, downloads PDF documents, keeps a local history and status for them, and sends them automatically or manually to Windows printers via SumatraPDF.
- QR GeneratorSimple full-stack tool for app distribution through a single QR code: define the iOS/Android links, generate a QR code pointing to a stable address, and redirect the mobile user to the appropriate store.
Want something similar?
Start with the estimate wizard — answer a few questions and get a realistic price range and timeline.